
Digging up financials for private companies requires more than a simple SEC search. You’ll lean on specialized databases, dig through government contracts, and scan industry news to connect the dots.
Why Private Company Financials Are So Hard To Find

At its core, the challenge is straightforward: they don’t have to tell you. Publicly traded firms file quarterly and annual statements with the U.S. Securities and Exchange Commission (SEC), creating a clear trail of their financial health. Private entities, by contrast, treat their numbers like a closely guarded playbook.
Protecting Competitive Advantages
Disclosing revenue, margins or operating costs is akin to handing rivals a roadmap. Those figures drive everything from pricing strategies to market expansion plans.
Tips From The Field:
- Review vendor contracts for unit prices
- Check patent applications for R&D insights
- Track job listings to estimate headcount trends
The Lack Of Regulatory Pressure
No SEC obligations means no easy download of a 10-K. Instead, you rely on creative sleuthing—piecing together data from:
- Local business registries
- Press releases on fundraising rounds
- Credit reports from industry services
You can explore these tactics further on the Library of Congress website.
Key Takeaway:
Mandatory reporting is the single biggest hurdle. Master the art of uncovering indirect clues, and you’ll have a clear view of a private company’s financial picture.
Imagine a sales rep sizing up a large prospect with no revenue figures to guide them. Or an investor hunting for red flags in a startup’s cash flow. Without these numbers, decision-making becomes a gamble—which is exactly why the strategies ahead are so vital.
When you’re serious about getting reliable, structured data on private companies, there’s no substitute for a premium financial database. This is the most direct route to the numbers you need, cutting out the guesswork and endless searching.
Think of it this way: while free sources often have you playing detective, piecing together clues, paid databases lay the facts out for you. They're built for professionals in finance, M&A, and competitive intelligence who need to base high-stakes decisions on solid information, not speculation.
Of course, not all databases are the same. Each has its own strengths, so picking the right one is all about what you’re trying to accomplish.
Picking the Right Tool for the Job
You wouldn't use a hammer to turn a screw. Similarly, the database you choose should match your specific research needs. Some are brilliant for tracking venture capital deals and startup funding, while others are built to dig into the financials of more mature, revenue-generating private businesses. Knowing the difference is crucial.
For instance, a platform like PitchBook is the undisputed leader for anything related to VC activity, funding rounds, and valuations. If you're analyzing the startup scene or keeping tabs on emerging tech, that's your starting point. On the other hand, Crunchbase is also great for tech and funding data but often has a broader, more accessible feel for general company research.
If your work involves managing a lot of this information, you might find our guide on how to build a startup company database helpful for keeping it all organized.
How It Works in the Real World
Let's walk through a common scenario. Say you’re a competitive analyst, and your boss asks you to find the annual revenue of a privately held software competitor in the U.S. with about 250 employees. This is exactly where a specialized database proves its worth.
This is where a tool like PrivCo comes into play. It was built specifically for this kind of challenge. PrivCo has a massive repository covering over 839,000 U.S.-based private companies, armed with more than 146 million individual data points. Their specialty is covering the 80% of U.S. companies that other platforms often miss, providing things like current and historical revenues, EBITDA, and growth metrics.
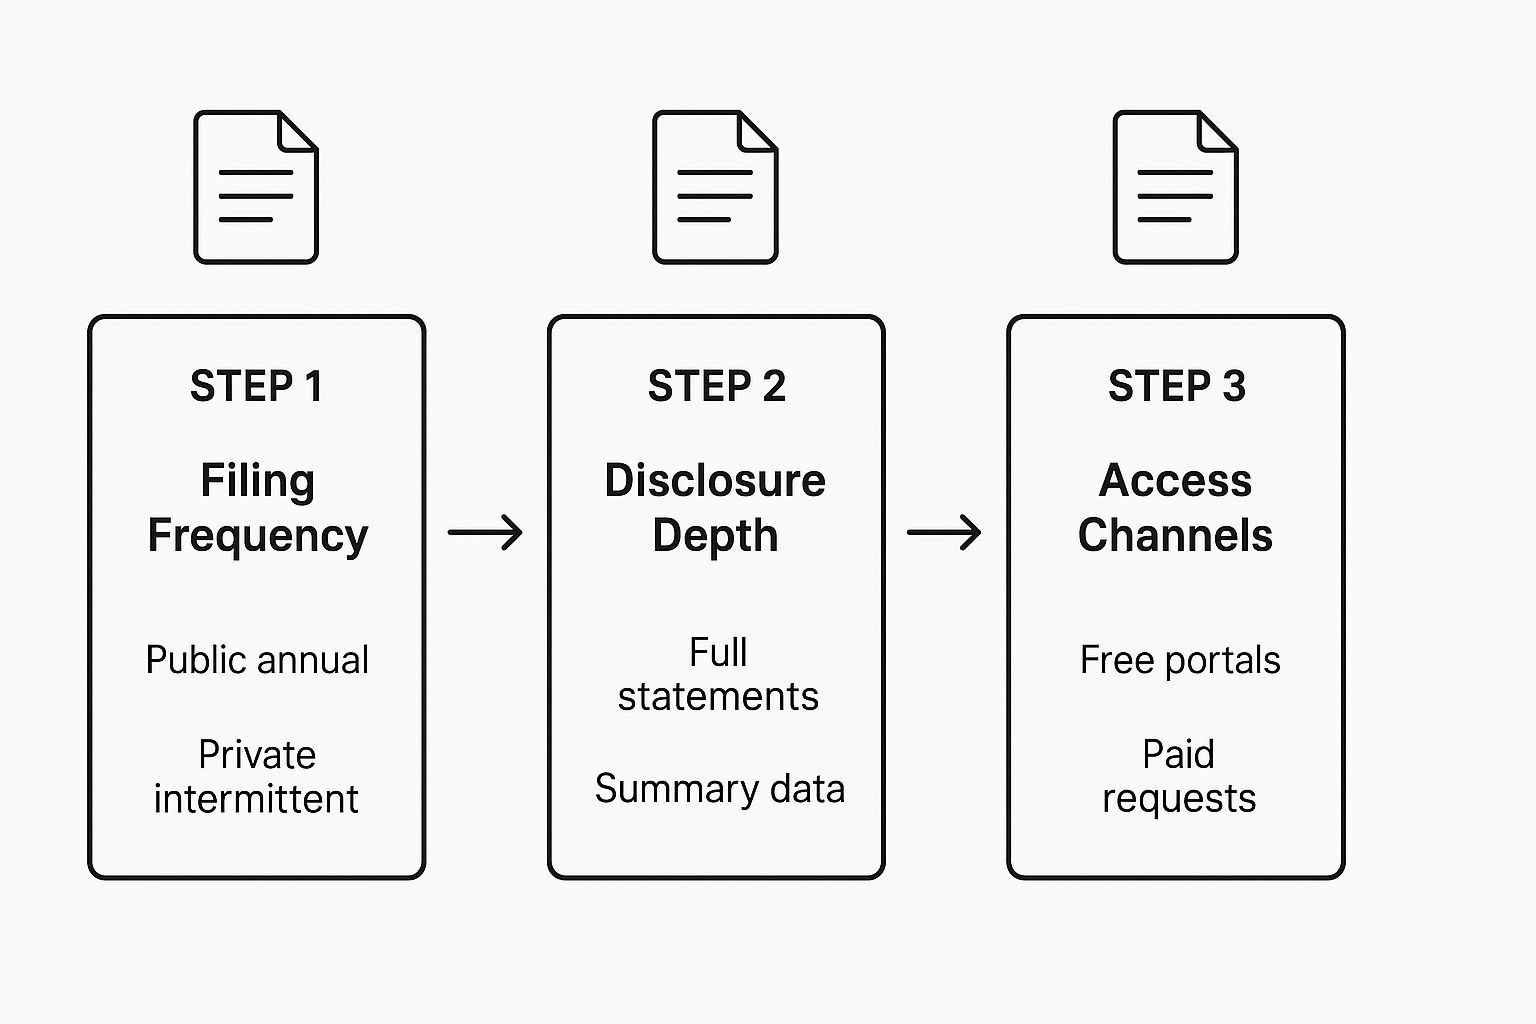
This image really highlights the core challenge: private company data is just fundamentally harder to get your hands on than public filings. It’s less frequent, not as detailed, and certainly not standardized.
My Take: The raw data in these platforms is great, but the real power is in the filters. The ability to screen companies by industry, employee count, location, and specific revenue ranges is what turns a list of thousands into a targeted list of your top five prospects. That’s the game-changer.
Comparison of Top Private Company Data Platforms
To help you get a clearer picture, I've put together a quick comparison of the heavy hitters in this space. Each platform serves a slightly different audience, so understanding their focus is key.
| Platform | Best For | Key Data Points | Typical User |
|---|---|---|---|
| PitchBook | VC, private equity, and M&A deal tracking | Funding rounds, valuations, cap tables, investor profiles | Venture Capitalists, Investment Bankers |
| Crunchbase | Tech startups and funding news | Company profiles, funding data, leadership info, news | Sales Reps, Recruiters, Journalists |
| PrivCo | In-depth financials of mature private companies | Revenue, EBITDA, employee growth, M&A activity | Corporate Strategy, M&A Analysts |
| Capital IQ | Comprehensive financial data and market intelligence | Detailed financials, public and private data, analytics | Financial Analysts, Asset Managers |
This table isn't exhaustive, but it gives you a solid starting point for figuring out which tool aligns with your day-to-day needs.
What's the Investment?
Access to this kind of quality-controlled information isn't free. The costs can be significant, but for professionals who rely on it, the ROI is clear. Pricing models usually fall into a few buckets:
- Per-Seat Licenses: A flat annual fee for each user on your team.
- Data Exports/API Access: You pay based on how much data you need to pull.
- Tiered Subscriptions: Different price points unlock different levels of data depth.
You can expect to pay anywhere from a few thousand dollars a year for basic access to well into five figures for enterprise-level licenses with all the bells and whistles.
My best advice? Always, always request a demo before you sign anything. Make sure the platform has solid data coverage for your specific industry and region. A little due diligence upfront ensures you're investing in a tool that will actually deliver the insights you need to make smart decisions.
Uncovering Financial Clues In Public Records
Private firms don’t file 10-Ks, but they leave traces in unexpected public documents. If you know where to look, a clear financial picture emerges from these scattered filings.
Sometimes premium databases miss what you’ll find here. It’s all about connecting the dots.

Most of these records were meant for compliance, not deep analysis. Yet a sharp researcher can pull out revenue streams, major customers, debt levels, and even early distress signals.
Tapping Into Government Contracts
Tracking government awards is one of the most reliable ways to pin down revenue. Federal, state and local agencies publish details of every contract they hand out.
For instance, a small cybersecurity outfit winning a $5 million deal with the Department of Defense instantly adds a hard data point to your revenue estimate.
Key portals include:
- USASpending.gov: The official federal spending hub, searchable by contractor name.
- State Procurement Portals: Every state runs its own site for local contracts—just search by company.
Confirmed figures beat rough guesses every time. When you’re valuing firms in the public-sector space, these sites should be your go-to.
Decoding UCC Filings
Any time a company borrows against assets—inventory, equipment, receivables—a Uniform Commercial Code (UCC) filing goes on record. It’s the lender’s public claim on those assets.
Reading a UCC filing tells you:
- Lender Details: Which bank or finance arm is involved.
- Collateral Listed: Exactly what’s pledged.
- Debt Indicators: Multiple filings often point to rising leverage.
On one occasion, I spotted a lien from a major bank on a manufacturer’s entire inventory—an early hint of a new credit line. On the flip side, overlapping claims from different lenders can flag serious cash-flow stress.
Pro Tip: A supplier lien over unpaid invoices is often the clearest red flag of cash shortages you won’t see in any press release.
Sifting Through Court Records
When a company hits legal trouble—whether a lawsuit or bankruptcy—it must expose detailed financial statements. These court filings often outshine any high-level summary you’ll find elsewhere.
Within a single bankruptcy petition you might uncover:
- Balance Sheets: A full breakdown of assets and liabilities.
- Income Statements: Revenues, expenses, and net results.
- Creditor Schedules: Who’s owed money and the exact amounts.
Digging through PACER can be time-intensive, but the payoff is huge. A few dockets could map out years of growth—and missteps—giving you a complete story of that private company’s financial journey.
Look Beyond Borders: Using Global and Industry-Specific Sources

Your hunt for private company financials shouldn’t be confined to just one country. Often, the most valuable insights pop up when you take a global view, especially if you're tracking multinational competitors or scoping out new markets. This is where the big international data providers really shine.
These global platforms offer a bird's-eye view that’s nearly impossible to piece together on your own. They pull data from countless international sources, giving you a standardized way to compare companies across different regions and regulatory landscapes. For anyone doing serious international market research, this broad scope is a must-have.
Tap Into the Big Global Financial Platforms
Providers like S&P Global and Refinitiv are the heavy hitters here. They compile financial data on millions of private companies around the world, making them the first stop for institutional investors and corporate strategists. Their real power is in the sheer volume and breadth of their data.
These platforms have invested heavily in expanding their private company coverage, blending massive financial datasets with powerful analytics. Take S&P Global, for instance. They track over 58 million private companies globally. That breaks down into more than 51 million in EMEA, around 3.7 million in the Americas, and another 2.9 million in the APAC region.
With that kind of scale, you can start doing some pretty sophisticated analysis—tracking complex supply chains, spotting foreign competitors you never knew existed, or evaluating international acquisition targets with a level of detail that used to be out of reach.
My Experience: When I'm digging into a company with a global footprint, these platforms are my first port of call. They help me sketch out a baseline financial profile and get a feel for the company's size and scale before I start digging into more specific, regional sources.
Add a Layer of Niche Industry Intelligence
While the big databases give you the "what," specialized industry reports often deliver the "why." Think of firms like Gartner or Forrester. They typically don't hand you raw financial statements. Instead, they provide sharp qualitative analysis, market positioning, and competitive intelligence that puts the raw numbers into context.
Let's say you're trying to figure out the market share of a private tech company in Europe. A global platform might give you a solid revenue estimate, but that's only half the story.
To build the full picture, you need to triangulate your data from a few places:
- Global Database: Start with a platform like S&P Global to pull an estimated annual revenue and see how they’ve grown over time.
- Industry Report: Next, grab a Gartner Magic Quadrant or Forrester Wave report. This will tell you about the company's product strengths, weaknesses, and how they stack up against their rivals.
- Local News & Filings: Finally, hit the local business registries to see if there are any mandatory filings that can confirm things like employee counts or director details.
This technique—combining broad financial data with deep industry know-how—is central to a solid competitor landscape analysis. By layering quantitative data with qualitative insights, you transform a simple revenue figure into a strategic understanding of that company's real position in the market. It’s the best way to validate what you’ve found and build a financial profile you can actually stand behind.
Thinking Like An Analyst With Creative Methods
When premium databases and public records come up empty, it’s time to change tactics. Think of yourself as a financial detective, gathering scattered clues instead of hunting a single definitive report.
News articles, press releases and executive interviews often hide the numbers you need. Companies love to share milestones, and a few well-placed details can unlock key insights.
Reading Between The Lines Of Company Announcements
A startup proclaiming a $10M Series A at a $50M post-money valuation has just handed you two vital data points. You know they sold 20% of their equity ($10M / $50M) and set a clear valuation benchmark.
When a CEO casually mentions “doubling our customer base last year” or “expanding into three new markets,” you’re not getting raw revenue figures—but you are seeing growth direction and momentum. Stack those remarks with news of new facilities or product launches, and you’ll piece together a convincing performance narrative.
Analyst’s Takeaway
A CEO’s comment about hitting profitability targets, combined with a press release about opening a new plant, signals solid operational health and likely positive cash flow—even without a published balance sheet.
Using Proxies To Estimate Revenue
One of the most reliable back-of-the-envelope tricks uses headcount as a revenue proxy:
- Employee Count: Check LinkedIn for current or historical staff numbers.
- Industry Benchmark: Look at public competitors to find average revenue per employee.
- Quick Calculation: Multiply the two for a reasonable revenue estimate.
For example, a SaaS provider with 100 employees and an industry average of $200,000 revenue per person suggests roughly $20 million in annual sales. This kind of creative problem-solving is a hallmark of effective competitive intelligence gathering.
Analyzing Hiring Trends For Growth Signals
Job postings often reflect a company’s financial confidence and strategic bets.
- Posting 15 New Enterprise Account Executives points to aggressive customer-acquisition goals.
- A spike in cost-control positions hints at internal belt-tightening.
- A hiring freeze? That could be a warning sign of cash flow constraints.
By monitoring these trends over weeks or months, you can infer whether a business is gearing up for rapid expansion or bracing for tougher times.
Answering Your Toughest Questions About Private Company Financials
So, you've started digging, but you're running into some common headaches. It's inevitable. Let's walk through the most frequent questions I get and how to handle them when you feel like you've hit a wall.
Even with the best databases in the world, you're going to come up empty sometimes. The real skill is knowing what to do next.
What If I Can't Find Any Financial Data at All?
First off, don't panic. This happens all the time, especially with smaller, newer, or more secretive companies. If your go-to databases and public records searches are turning up nothing, it's time to pivot. You need to stop looking for hard numbers and start hunting for directional clues.
This is where you have to get a little creative. Go back to those alternative methods we talked about earlier. Check out their hiring patterns on LinkedIn—are they staffing up their sales team? Dig into local business journals for any mentions or awards. Every little piece of information helps you build a mosaic of the company's health and trajectory, even if it's not a P&L statement.
How Can I Actually Verify This Data?
This is a big one. You'll find that estimates can be all over the place, so you have to be skeptical. The gold standard here is triangulation. I never, ever trust a single data point on its own.
- Check it against another database: If PitchBook estimates revenue at $15 million, what does a platform like PrivCo or FactSet say? Are they in the same ballpark?
- Look for public records: Did the company land a $5 million government contract last year? That gives you a solid, verifiable floor for their revenue.
- Find supporting evidence: Is there a press release bragging about a new factory or a massive expansion? That should line up with any data showing significant growth.
My Two Cents
Think of every data point as a piece of a puzzle. A single number is just a hint. But when three independent sources all point in the same direction, you can start to feel confident that you're getting close to the truth.
Can I Get Real-Time Financials?
For a private company? The short answer is almost always no. This isn't like tracking a public company with its quarterly reports. Private company data is rarely fresh.
The information you find in databases is usually based on annual filings, surveys, or proprietary models. That means the data could easily be anywhere from six to eighteen months old.
Your best bet for anything current will come from indirect signals. Keep your eyes peeled for:
- Funding news: A fresh venture round gives you a very recent valuation.
- Executive interviews: Sometimes a CEO will drop a hint about recent performance in an industry podcast or article.
- Big contract wins: News of a major new client is a fantastic, up-to-the-minute indicator of growth.
By piecing together the historical data you can find with these more current clues, you'll be able to paint a much sharper, more accurate picture of where the company stands right now.